See Neo-Graph in Action
Watch how your trading data transforms into powerful insights
Turn Your Scalable Trading History Into Valuable Insights
Upload your CSV trading history and instantly transform it into beautiful visualizations, comprehensive analytics, and actionable insights. Track performance, manage portfolios, and make better trading decisions.
Everything You Need to Succeed
Powerful tools built for traders who want real insights from their data.
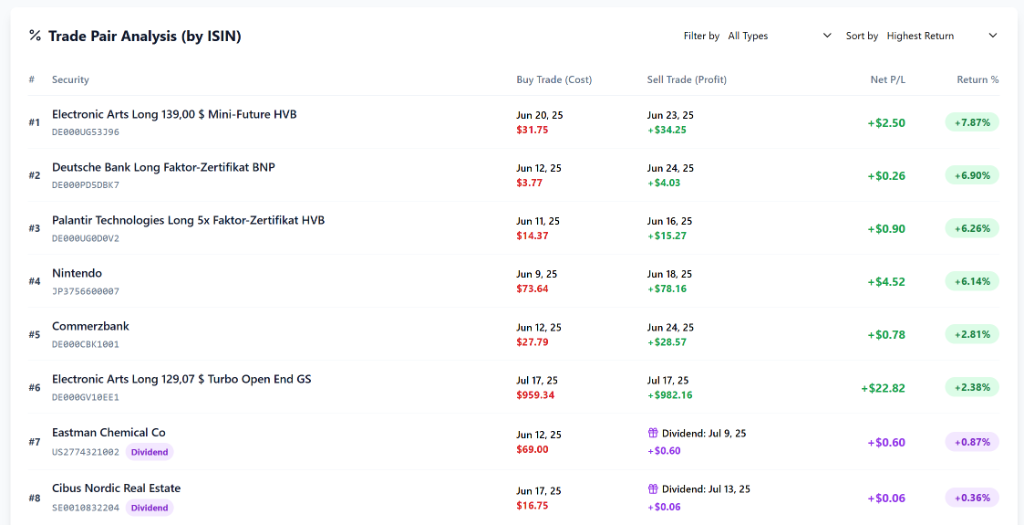
Trade Pair Analytics
Automatically match buy & sell orders to compute precise P&L for every trade.
Performance Charts
Beautiful interactive charts showing your cumulative performance over time.
Tax Reports
Export detailed tax-ready reports from your Scalable Capital trading history.
Market Watch
Track your watchlist with real-time stock prices powered by Google Finance.
Custom Newsfeed
Aggregate Reddit, YouTube, TikTok and financial websites in one feed.
Smart Alerts
Set price targets and filing alerts so you never miss a key market event.
Drop your Scalable Capital CSV here
Instant processing & analysis
Upload Your CSV, Get Instant Insights
Simply drag and drop your trading history from Scalable Capital. Our intelligent system automatically processes your data, identifies trade pairs, and calculates your performance metrics in seconds.
Automatic Trade Pairing
Matches buy and sell orders to calculate precise P&L automatically
Scalable Capital CSV
Specifically optimized for Scalable Capital data format
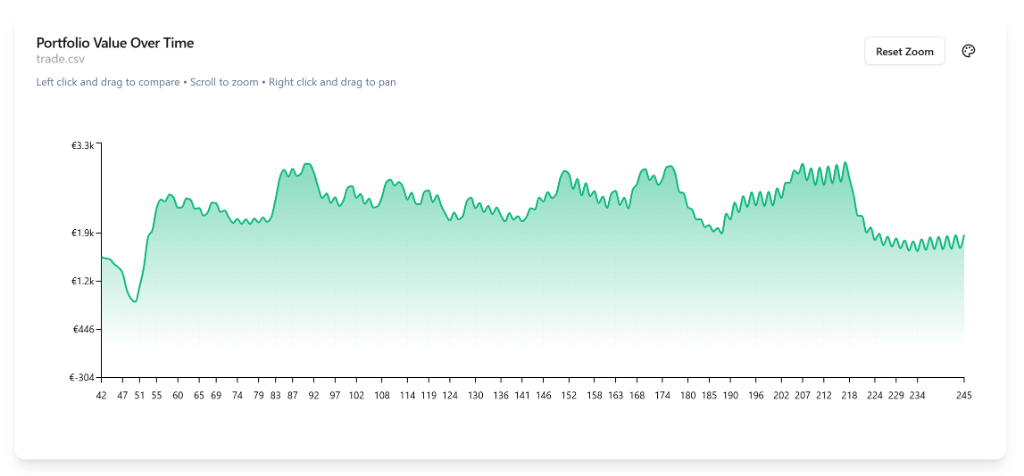
Beautiful Performance Visualizations
Transform your raw data into stunning, interactive charts that tell the story of your trading journey. Track your cumulative performance, identify winning strategies, and spot areas for improvement.
Interactive Charts
Hover, zoom, and explore your trading data in stunning detail
Multiple Views
Performance, tax reports, portfolio value, and comprehensive analytics
Stay Informed with Live Market Data
Monitor your watchlist with real-time stock prices and create personalized news feeds from Reddit, YouTube, financial websites, and more. All your market intelligence in one place.
Real-Time Stock Prices
Live data from Google Finance for your complete watchlist
Custom News Feeds
Add Reddit, YouTube, TikTok and websites by URL
Your Personalized Newsfeed
Connect your Neo-Graph account to the social media and news sources you already rely on. Organise everything in one place, tailored to how you stay informed.
Reddit Communities
Link your favourite subreddits — r/wallstreetbets, r/stocks and any community that matters to you — directly into your feed.
YouTube Channels
Add your go-to trading YouTubers and analysts. Their latest videos surface right inside Neo-Graph, no tab-switching needed.
Any Website or Blog
Paste a URL — financial news site, analyst blog, or niche forum — and Neo-Graph integrates it into your personalised dashboard.
One Organised Feed
Every source you follow, ranked and organised your way. No algorithm, no noise — just the news and content you chose.
Simple, Transparent Pricing
Choose your plan and start analyzing today
Monthly
Billed monthly
- Unlimited CSV uploads
- Advanced analytics & insights
- Real-time market data
- Custom news feeds
- Portfolio tracking
- Tax reports & exports
- Priority support
Annual
Billed annually
- Unlimited CSV uploads
- Advanced analytics & insights
- Real-time market data
- Custom news feeds
- Portfolio tracking
- Tax reports & exports
- Priority support
Frequently Asked Questions
From Passion to Platform
From a young age, I was interested in the world of stocks and trading. I went to my local bank, opened a stock account, and bought my first stocks. The excitement and possibilities of the stock market got me hooked, but I slowly realised how expensive it was to buy stocks through traditional brokers.
The rise of neo-brokers brought with it the rise of neo-graphs: the solution to visualising graphs in detail and working in tandem with those low-brokerage-fee platforms. I am selling a service that I use daily too. This is my passion project brought to life, for anyone who shares my curiosity and determination to achieve financial security and independence by utilising the best neo-brokers and supplementary tools, such as Neo-graphs.
Trading stocks isn't easy, but I can make it easier with the tools I provide, which I also use privately. We have the same goals and tools. Let's see how far we can get together!
Ready to Transform Your Trading Analytics?
Join traders who've discovered the power of data-driven insights. Start analyzing your trades and improve your performance today.